[Cilium Study 1기 by Gasida] 2주차 - 도전과제1 Dynamic exporter configuration (hubble flow logs) 로 파일 출력 후 해당 파일을 수집하여 볼 수 있는 로깅 시스템 구성해보기
아키텍처
Dynamic exporter configuration (hubble flow logs) 로 파일 출력 후 해당 파일을 수집하여 볼 수 있는 중앙 로깅 시스템 구성해본다. 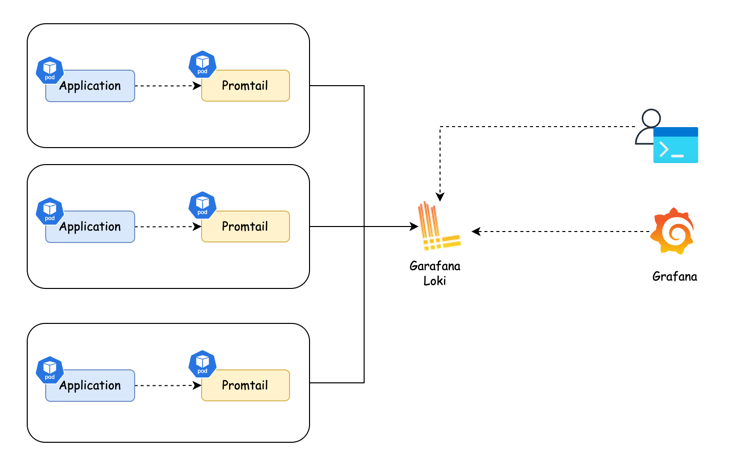
Vagrant를 이용한 쿠버네티스 환경 구축
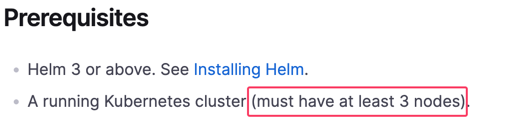
vagrant를 사용하여 쿠버네티스 클러스터를 구축한다. helm차트를 이용하여 배포할 것인데 공식문서를 보니 최소 3개 노드를 요구한다.
아래 명령어를 실행하여 배포하자.
1
2
3
mkdir cilium-lab && cd cilium-lab
curl -O https://raw.githubusercontent.com/gasida/vagrant-lab/refs/heads/main/cilium-study/2w/Vagrantfile
vagrant up
Dynamic exporter configuration
기존의 static hubble exporter설정에서는
- 로그 필터 조건을 한 세트만 지정 가능
- 필터를 바꾸려면 Cilium 파드 재시작이 필요
- 여러 종류의 로그를 따로 저장하고 싶어도 불가
와 같은 한계점이 존재한다.
Dynamic Hubble Exporter는 아래와 같은 개선을 제공한다.
| 기능 | 설명 |
|---|---|
| 라이브 적용 | 설정을 바꿔도 Cilium Pod 재시작 불필요 (최대 60초 내 반영) |
| 다중 로그 파일 | 여러 개의 로그 파일을 동시에 다르게 구성 가능 |
| 여러 필터 동시 설정 | 서로 다른 필터 조건을 각 로그에 지정 가능 |
| 자동 종료 | 특정 시간 이후 자동으로 로그 수집 종료 |
| 정책 필터링, 마스킹 지원 | source/destination pod, verdict 등 필드 선택적 출력 |
헬름 upgrade를 통해 설정 변경한다.
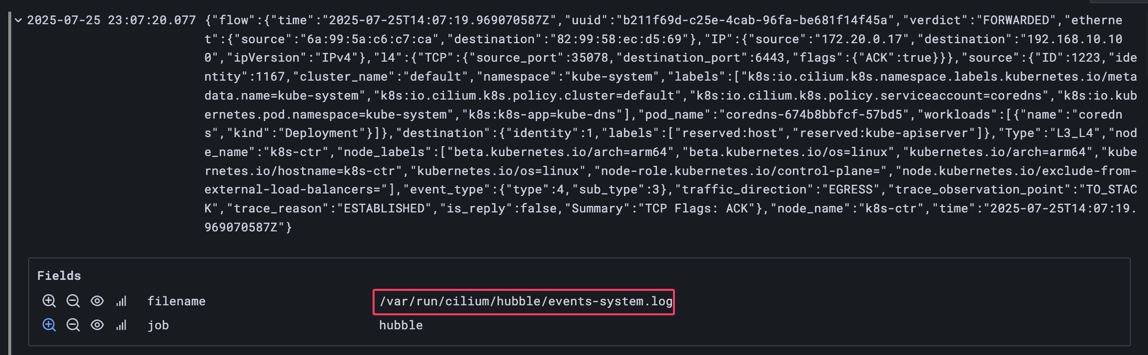
위 명령으로 events-system이라는 파일이름의 로그 구성이 생성되고, 해당 필터에 맞는 Flow만 /var/run/cilium/hubble/events-system.log에 기록된다.
1
2
3
4
5
6
7
8
9
helm upgrade cilium cilium/cilium --version 1.17.6 \
   --namespace kube-system \
   --reuse-values \
   --set operator.replicas=1 \
   --set hubble.enabled=true \
   --set hubble.export.dynamic.enabled=true \
   --set hubble.export.dynamic.config.enabled=true \
   --set hubble.export.dynamic.config.content[0].name=system \
   --set hubble.export.dynamic.config.content[0].filePath=/var/run/cilium/hubble/events-system.log
helm으로 loki설치하기
그라파나 레포지토리를 추가하고 업데이트한다.
1
2
helm repo add grafana https://grafana.github.io/helm-charts
helm repo update
values.yaml 작성하고 시각화하기 위하여 grafana를 true로 설정한다. 각 노드에 들어갈 promtail파드도 true로 설정되어있는 것을 확인 할 수 있다.
1
2
helm search repo loki
helm show values grafana/loki-stack > values.yaml
grafana를 true로 설정해준다 ```yaml values.yaml test_pod: enabled: true image: bats/bats:1.8.2 pullPolicy: IfNotPresent
loki: enabled: true isDefault: true url: http://: readinessProbe: httpGet: path: /ready port: http-metrics initialDelaySeconds: 45 livenessProbe: httpGet: path: /ready port: http-metrics initialDelaySeconds: 45 datasource: jsonData: “{}” uid: “”
promtail: enabled: true config: logLevel: info serverPort: 3101 clients: - url: http://:3100/loki/api/v1/push
…
grafana: enabled: true # =============================== true로 설정 sidecar: datasources: label: “” labelValue: “” enabled: true maxLines: 1000 image: tag: 10.3.3
…
1
2
3
4
5

위에서 변경한 `values.yaml`을 인스톨하자.

```bash
helm install --values values.yaml loki grafana/loki-stack
1
2
3
4
5
6
7
8
9
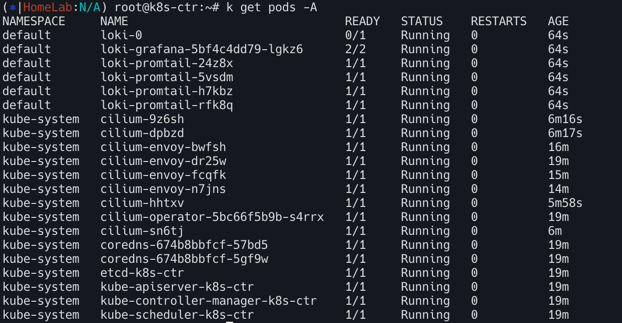
# promtail확인하기
kubectl get pods
#NAME READY STATUS RESTARTS AGE
#loki-0 1/1 Running 1 (22h ago) 22h
#loki-grafana-57b9fc967b-9tksw 2/2 Running 2 (22h ago) 22h
#loki-promtail-hh827 1/1 Running 1 (22h ago) 22h
#loki-promtail-ktmp6 1/1 Running 1 (22h ago) 22h
#loki-promtail-p9kcs 1/1 Running 1 (22h ago) 22h
#loki-promtail-rwp5z 1/1 Running 1 (22h ago) 22h
각 노드에 설치되어있는 promtail 파드를 확인 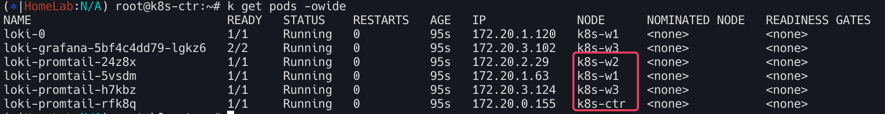
promtail 설정 변경
promtail 시크릿을 가져와서 base64디코딩을 진행하여 파일로 저장하자.
1
kubectl get secret  loki-promtail -o jsonpath="{.data.promtail\.yaml}" | base64 --decode > promtail.yaml
아래는 promtail 설정 파일이다. 아래의 job을 추가해줄 것이다. 타겟 호스트와 잡 이름, 그리고 로그 경로를 설정해준다.
1
2
3
4
5
6
7
    - job_name: hubble-flowlogs
      static_configs:
          - targets:
              - localhost
            labels:
              job: hubble
              __path__: /var/run/cilium/hubble/events-system.log
전체 파일
1
2
3
4
5
6
7
8
9
10
11
12
13
14
15
16
17
18
19
20
21
22
23
24
25
26
27
28
29
30
31
32
33
34
35
36
37
38
39
40
41
42
43
44
45
46
47
48
49
50
51
52
53
54
55
56
57
58
59
60
61
62
63
64
65
66
67
68
69
70
71
72
73
74
75
76
77
78
79
80
81
82
83
84
85
86
87
88
89
90
91
92
93
94
95
96
97
98
99
100
101
102
103
104
105
106
107
server:
  log_level: info
  log_format: logfmt
  http_listen_port: 3101

clients:
  - url: http://loki:3100/loki/api/v1/push

positions:
  filename: /run/promtail/positions.yaml

scrape_configs:
  # Kubernetes Pod 로그 수집
  - job_name: kubernetes-pods
    pipeline_stages:
      - cri: {}
    kubernetes_sd_configs:
      - role: pod
    relabel_configs:
      - source_labels:
          - __meta_kubernetes_pod_controller_name
        regex: ([0-9a-z-.]+?)(-[0-9a-f]{8,10})?
        action: replace
        target_label: __tmp_controller_name

      - source_labels:
          - __meta_kubernetes_pod_label_app_kubernetes_io_name
          - __meta_kubernetes_pod_label_app
          - __tmp_controller_name
          - __meta_kubernetes_pod_name
        regex: ^;*([^;]+)(;.*)?$
        action: replace
        target_label: app

      - source_labels:
          - __meta_kubernetes_pod_label_app_kubernetes_io_instance
          - __meta_kubernetes_pod_label_instance
        regex: ^;*([^;]+)(;.*)?$
        action: replace
        target_label: instance

      - source_labels:
          - __meta_kubernetes_pod_label_app_kubernetes_io_component
          - __meta_kubernetes_pod_label_component
        regex: ^;*([^;]+)(;.*)?$
        action: replace
        target_label: component

      - action: replace
        source_labels:
          - __meta_kubernetes_pod_node_name
        target_label: node_name

      - action: replace
        source_labels:
          - __meta_kubernetes_namespace
        target_label: namespace

      - action: replace
        replacement: $1
        separator: /
        source_labels:
          - namespace
          - app
        target_label: job

      - action: replace
        source_labels:
          - __meta_kubernetes_pod_name
        target_label: pod

      - action: replace
        source_labels:
          - __meta_kubernetes_pod_container_name
        target_label: container

      - action: replace
        replacement: /var/log/pods/*$1/*.log
        separator: /
        source_labels:
          - __meta_kubernetes_pod_uid
          - __meta_kubernetes_pod_container_name
        target_label: __path__

      - action: replace
        regex: true/(.*)
        replacement: /var/log/pods/*$1/*.log
        separator: /
        source_labels:
          - __meta_kubernetes_pod_annotationpresent_kubernetes_io_config_hash
          - __meta_kubernetes_pod_annotation_kubernetes_io_config_hash
          - __meta_kubernetes_pod_container_name
        target_label: __path__

  # ------------Hubble 로그 수집 (Dynamic Flow Logs)--------------
  - job_name: hubble-flowlogs
    static_configs:
      - targets:
          - localhost
        labels:
          job: hubble
          __path__: /var/run/cilium/hubble/events-system.log

limits_config: {}

tracing:
  enabled: false
디코딩한 시크릿을 다시 업데이트하기 위해 기존secret의 loki-promtail을 지우고 Hubble 로그 수집한 부분을 추가하여 업데이트한다.
1
2
kubectl delete secret loki-promtail
kubectl create secret generic loki-promtail --from-file=./promtail.yaml
Promtail Pod에서 경로 마운트
loki-promtail의 데몬셋에 볼륨마운트하여 promtail파드가 hubble 로그를 가져올 수 있도록하자.
1
2
3
4
5
6
7
8
      volumeMounts:
        - name: hubble-logs
          mountPath: /var/run/cilium/hubble
    volumes:
      - name: hubble-logs
        hostPath:
          path: /var/run/cilium/hubble
          type: DirectoryOrCreate
전체 loki-promtail daemon-set
1
2
3
4
5
6
7
8
9
10
11
12
13
14
15
16
17
18
19
20
21
22
23
24
25
26
27
28
29
30
31
32
33
34
35
36
37
38
39
40
41
42
43
44
45
46
47
48
49
50
51
52
53
54
55
56
57
58
59
60
61
62
63
64
65
66
67
68
69
70
71
72
73
74
75
76
77
78
79
80
81
82
83
84
85
86
87
88
89
90
91
92
93
94
95
96
97
98
99
100
101
102
103
104
105
106
107
108
109
110
111
112
113
114
115
116
117
118
119
120
121
122
123
124
125
126
127
128
129
130
131
132
133
apiVersion: apps/v1
kind: DaemonSet
metadata:
  annotations:
    deprecated.daemonset.template.generation: "1"
    meta.helm.sh/release-name: loki
    meta.helm.sh/release-namespace: default
  creationTimestamp: "2025-07-24T14:29:23Z"
  generation: 1
  labels:
    app.kubernetes.io/instance: loki
    app.kubernetes.io/managed-by: Helm
    app.kubernetes.io/name: promtail
    app.kubernetes.io/version: 2.9.3
    helm.sh/chart: promtail-6.15.5
  name: loki-promtail
  namespace: default
  resourceVersion: "5237"
  uid: 5192c926-6d93-4357-be24-64577158b672
spec:
  revisionHistoryLimit: 10
  selector:
    matchLabels:
      app.kubernetes.io/instance: loki
      app.kubernetes.io/name: promtail
  template:
    metadata:
      annotations:
        checksum/config: 0f49fcd7a8fab642f9644e0a4d67b9f2bf9ce3e2cbf1f2ebfa7a301dbd59a7e0
      creationTimestamp: null
      labels:
        app.kubernetes.io/instance: loki
        app.kubernetes.io/name: promtail
    spec:
      containers:
      - args:
        - -config.file=/etc/promtail/promtail.yaml
        env:
        - name: HOSTNAME
          valueFrom:
            fieldRef:
              apiVersion: v1
              fieldPath: spec.nodeName
        image: docker.io/grafana/promtail:2.9.3
        imagePullPolicy: IfNotPresent
        name: promtail
        ports:
        - containerPort: 3101
          name: http-metrics
          protocol: TCP
        readinessProbe:
          failureThreshold: 5
          httpGet:
            path: /ready
            port: http-metrics
            scheme: HTTP
          initialDelaySeconds: 10
          periodSeconds: 10
          successThreshold: 1
          timeoutSeconds: 1
        resources: {}
        securityContext:
          allowPrivilegeEscalation: false
          capabilities:
            drop:
            - ALL
          readOnlyRootFilesystem: true
        terminationMessagePath: /dev/termination-log
        terminationMessagePolicy: File
        volumeMounts:
        - mountPath: /etc/promtail
          name: config
        - mountPath: /run/promtail
          name: run
        - mountPath: /var/run/cilium/hubble
          name: hubble-logs
        - mountPath: /var/lib/docker/containers
          name: containers
          readOnly: true
        - mountPath: /var/log/pods
          name: pods
          readOnly: true
      dnsPolicy: ClusterFirst
      enableServiceLinks: true
      restartPolicy: Always
      schedulerName: default-scheduler
      securityContext:
        runAsGroup: 0
        runAsUser: 0
      serviceAccount: loki-promtail
      serviceAccountName: loki-promtail
      terminationGracePeriodSeconds: 30
      tolerations:
      - effect: NoSchedule
        key: node-role.kubernetes.io/master
        operator: Exists
      - effect: NoSchedule
        key: node-role.kubernetes.io/control-plane
        operator: Exists
      volumes:
      - name: config
        secret:
          defaultMode: 420
          secretName: loki-promtail
      - hostPath:
          path: /run/promtail
          type: ""
        name: run
      - hostPath:
          path: /var/lib/docker/containers
          type: ""
        name: containers
      - hostPath:
          path: /var/log/pods
          type: ""
        name: pods
      - hostPath:
          path: /var/run/cilium/hubble
          type: DirectoryOrCreate
        name: hubble-logs
  updateStrategy:
    rollingUpdate:
      maxSurge: 0
      maxUnavailable: 1
    type: RollingUpdate
status:
  currentNumberScheduled: 4
  desiredNumberScheduled: 4
  numberAvailable: 4
  numberMisscheduled: 0
  numberReady: 4
  observedGeneration: 1
  updatedNumberScheduled: 4
kubectl edit ds loki-promtail 로 업데이트한다.

접속 확인하기
1
2
3
4
5
6
7
8
9
10
11
#시크릿 확인
kubectl get secret
#NAME                         TYPE                 DATA   AGE
#loki                         Opaque               1      22h
#loki-grafana                 Opaque               3      22h
#loki-promtail                Opaque               1      22h
#sh.helm.release.v1.loki.v1   helm.sh/release.v1   1      22h

#패스워드 확인
kubectl get secret loki-grafana -o jsonpath="{.data.admin-password}" | base64 --decode
#6vPbKxwEqb0zulpkuc9M8QGOwGX91g9iR3AHEEdl
1
2
3
4
## Grafana 접속
kubectl port-forward pod/loki-grafana-57b9fc967b-9tksw --address 0.0.0.0 3000:3000
#OR
kubectl port-forward svc/loki-grafana --address 0.0.0.0 3000:80
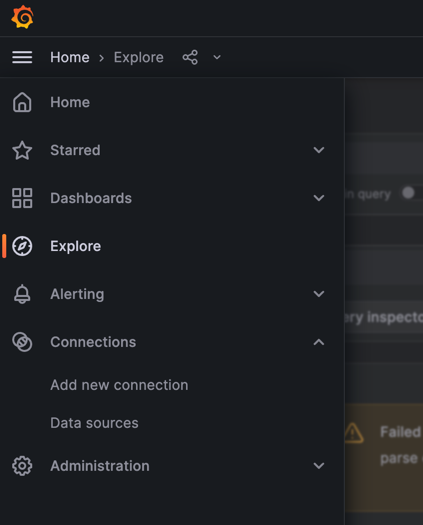
위에서 얻은 패스워드로 admin으로 접속한다. 그리고 왼쪽 메뉴에서 Explore를 선택하자.
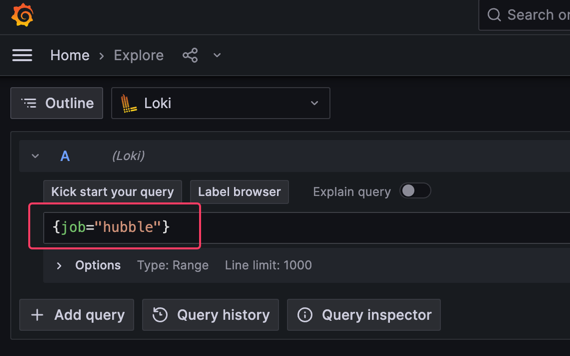
위에서 job이름을 hubble로 설정 하였으므로 {job="hubble"}을 넣어 쿼리해보자.
1
2
3
4
5
6
7
- job_name: hubble-flowlogs
  static_configs:
  - targets:
    - localhost
      labels:
      job: hubble # {job="hubble"}
      __path__: /var/run/cilium/hubble/events-system.log
위에서 동적으로 설정한 로그이름(events-system.log)가 그라파나에서 확인이 가능해졌다.